After revising some data structures recently, I thought it'd be an interesting challenge to write some of them in C. I started with a linked list, and then went on to use the linked list in a Hashtable. The code can be found here.
The interface is fairly simple, with ht_set, ht_get and ht_delete forming the main API for interacting with a hashtable. To create a hashtable the code provides ht_create, and to destroy it (fittingly) ht_destroy should be called. This last function takes pains to clear up each "chain" (linked list) as well as the underlying hashtable itself.
When implementing hashtables in the past, I've fallen into the trap of allowing insertions/deletions become O(n) as the table grows. This is because I haven't implemented Table Doubling: a method for ensuring that the load factor of a hashtable remains low as more and more elements are added.
As soon as the load factor reaches a preset limit (defined in hashtable.h), the table will resize itself at the next ht_set operation. This is accomplished by iterating through each of the linked lists comprising the old hashtable, re-hashing every element, and adding it to a new table double the size of the original.
This resizing is a costly operation, but as the table grows it happens exponentially less frequently. For very small sizes of table, a linked list (or even simply allocating an array) may have less overhead; for larger maps this is ideal.
Here's the full code of the ht_set operation:
To verify that the hashtable was performing as expected I profiled it in depth in this Jupyter Notebook. This demonstrated that the time taken to insert, retrieve or delete a value didn't grow with the number of elements in the hash table. In other words, the asymptotic time complexity of these operations was constant: O(1).
Here's a chart from the notebook showing the (lack of) growth:
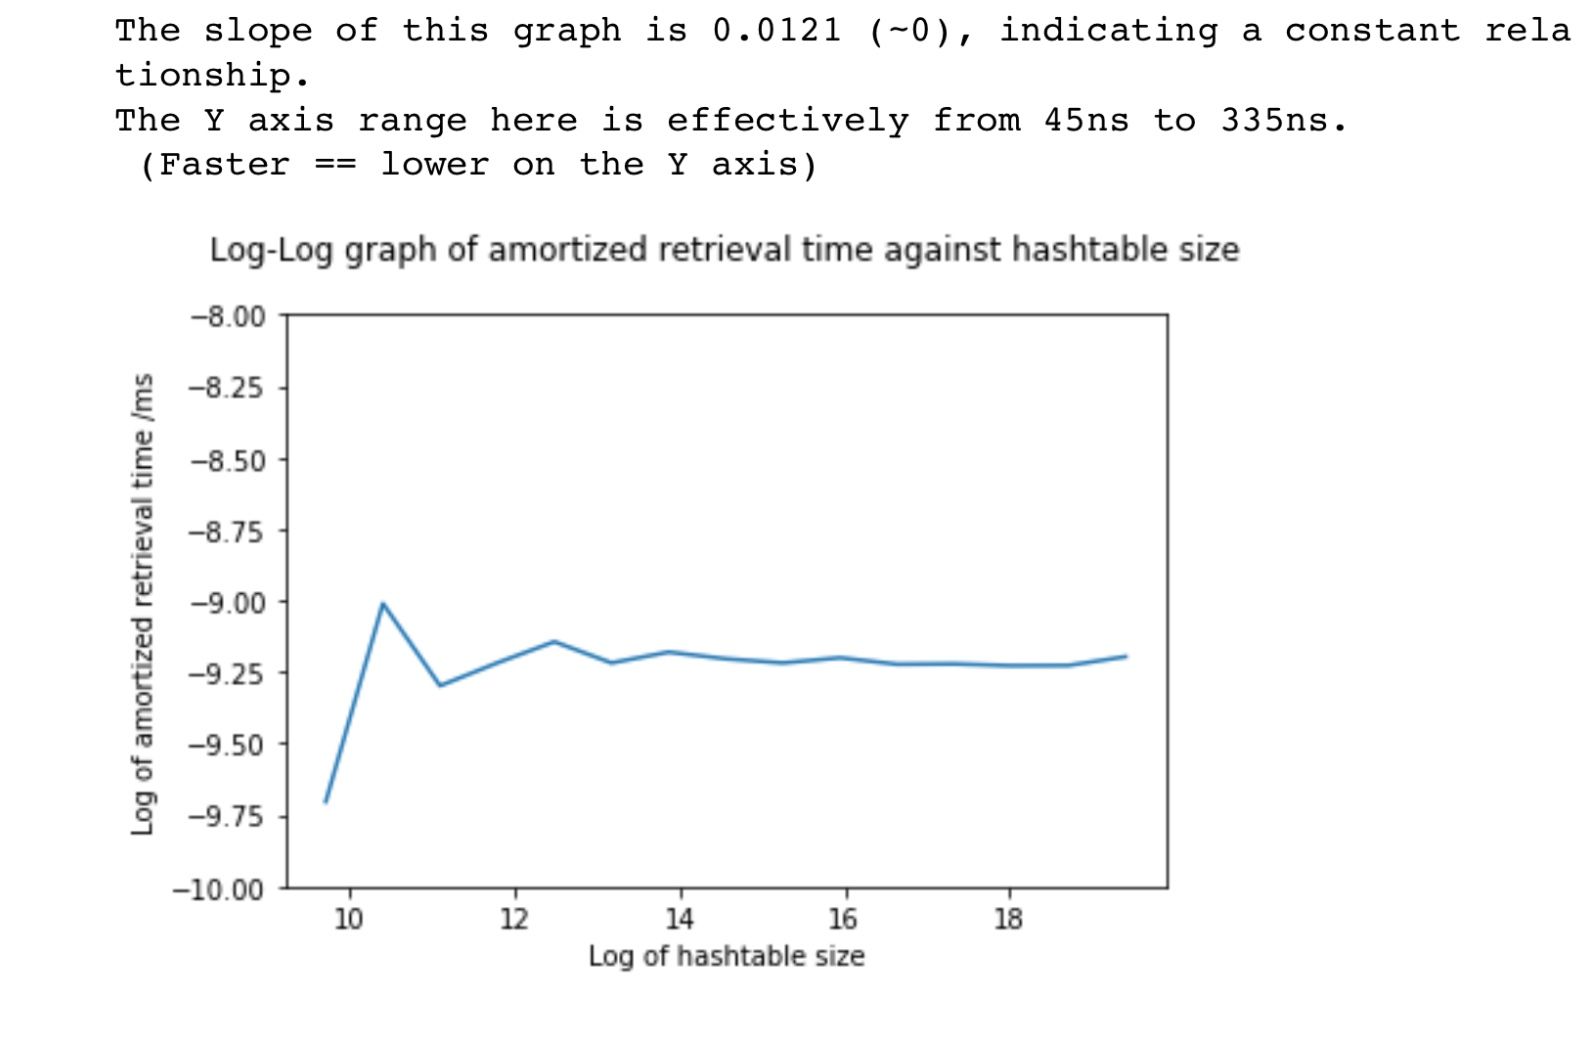
The maths behind log-log graphs is somewhat tedious if you don't already have a good intuition for it, but generally speaking the slope of a log-log graph indicates the power relationship. For example, if the slope of a log(y)/log(x) graph is 3, then we can say y is related to x^3. In this case, the slope is close to zero, so we can say y is a constant value – not related to the value of x, which in this chart is the size of the hashtable.
I also ensured that the table had no memory leaks by using Valgrind. In order to do this I had to use a Docker container, as Valgrind refused to build on my (beta) version of MacOS. This was a fairly straightforward use of Docker but did involve mounting the source directory as a volume, so the image wouldn't have to be rebuilt every time the source code changed.