Hashtables are a neat way of storing (key, value) pairs with fast lookup, insertion and deletion times. I've written a simple implementation of a hashtable with a view to making an extremely easy-to-understand base to improve upon, and I thought it'd be a useful exercise to profile this initial attempt and see exactly how it's doing.
There's a more detailed overview here, but here's a brief summary of the data structure used:
- Fixed array of "buckets"
- Hash function maps each key to a bucket
- Relatively poor hash used (first character of the key)
- "Chaining", i.e. a linked-list for each bucket, for collision handling
- Values consist of a
void *pointer to the start of some data and alongsize (in bytes, or as interpreted by the user) - No resizing, so the size at the start is fixed
While this is clearly a very simplistic data structure, I thought it would be interesting to profile the code in a "worst case" scenario (large inputs!) and plot the results.
In order to profile the code, I wrote a simple getTime() method:
double getTime() {
  struct timespec time;
  clock_gettime(CLOCK_REALTIME, &time);

  // Todo: use time.tv_nsec for higher-res time.
  double currentTime = time.tv_sec;
  return currentTime;
}
This only has a resolution of seconds -- this can be improved upon! -- but for large inputs we should be able to see a pattern emerge regardless.
I wrote a simple loop from 1-50, each time adding more elements into the hashmap, and timed each iteration of the loop. Funnily enough, my computer decided that using 50GB of memory was just too much (!) and killed the process after 39. I tweaked the parameters to start at 39, and got the complete set of results I was after.
...
Stress test (8) took 2 seconds
Stress test (9) took 2 seconds
Stress test (10) took 3 seconds
...
Stress test (19) took 6 seconds
...
But seeing a long list of timings in seconds didn't give me an idea of the growth of the algorithm. I had a hunch that the fact my table didn't resize would mean that the algorithm would grow like O(n) -- linear time, since we'd have to be traversing a linked-list of n / table_size each time, where table-size is a constant defined at compile-time.
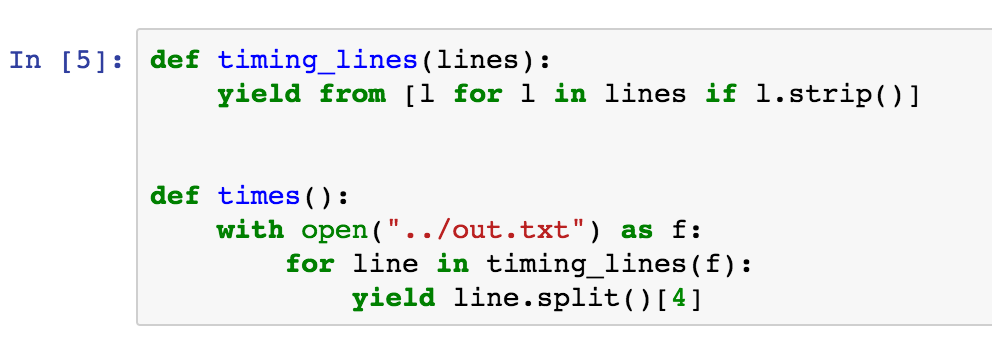
Instead of plugging the values into Excel by hand, I thought I'd give the shiny new Jupyter notebook a try! First of all, I wrote a couple of helper functions to load the timings in from a file and strip off any extraneous information.
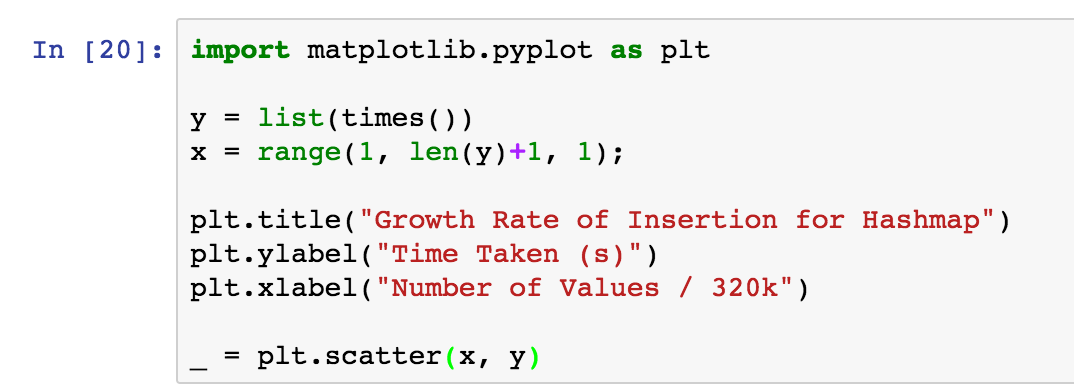
I made sure to import the pyplot name from matplotlib, and defined the axes for a scatter-plot of Time over Number of Values.
To show the scatter plot, all I had to do was call plt.show()!
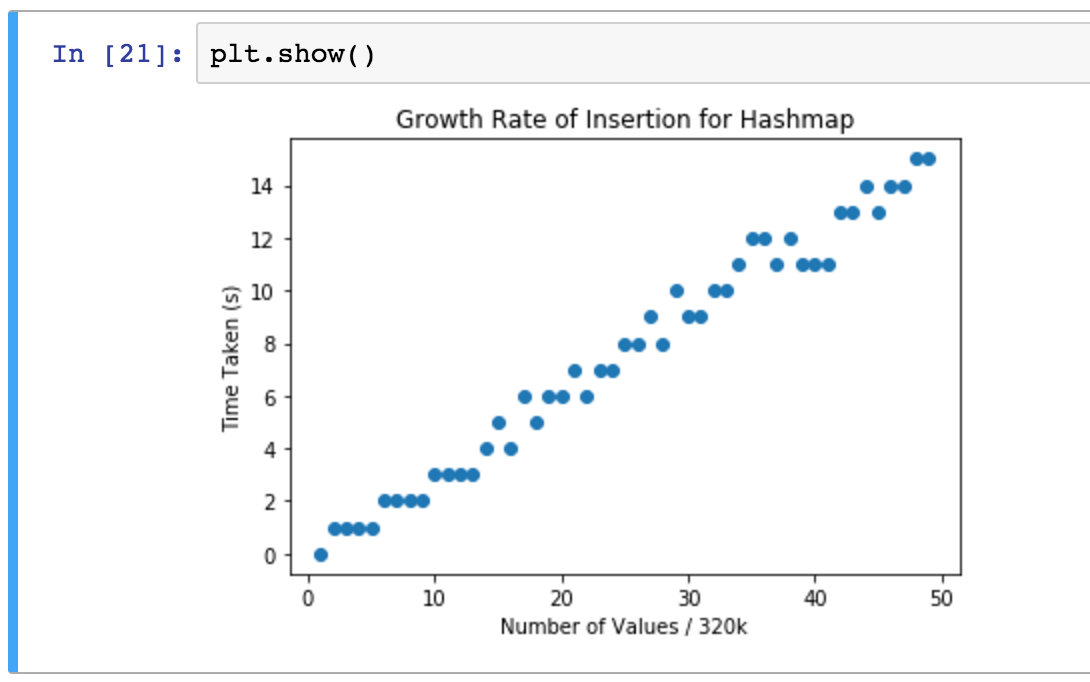
Now, that looks pretty linear to me. This is good motivation to carry on and optimize it until we get a nice log(n) graph! But for posterity, here's a couple of reasons we might not be getting precise and accurate test results:
- The memory use was insane for this test. At one point it reached 50GB; given that my machine has only 16GB of RAM, this means it will have been swapping out memory nearly constantly. Clearly this is unacceptable.
- We're firmly in the "worst case" scenario, defining only 8 buckets. If we preallocated more buckets, we might get something looking more like a log graph, before we reached load factors >= 1.
- The
getTime()function has only a precision of 1 second, where the system allows for a precision of milliseconds. This greater precision should be used!
To improve the time complexity of this algorithm, the big change that needs to be made is resizing the buckets depending on the load factor of the table. This will be a single costly operation, but will cause the function to maintain relatively short linked lists.
As well as this, the hash function needs drastic improvement. It should be chaotic, i.e. return very different results for the same input; this will stop inputs "clustering" around a few buckets.
We should also consider other solutions to hash-collision handling: linear probing is somewhat inefficient, but using a Linear Congruential Random Generator can provably iterate over all buckets in a semi-unpredictable fashion. Using this along with separate "sparse" and "dense" arrays may also lead to huge cuts in memory use: see PyPy's dict type, and more recently CPython's dict type.